1. In the Matrices window, in the navigator, select the matrices of your choice.
2. Right-click one of the matrices you selected.
The context menu opens.
3. Choose Create histogram.
|
Tip: Alternatively, on the tab toolbar, click the |

The Matrix histogram (Matrix <Matrix name> window opens.
|
Note: If you select several matrices, instead of the matrix name, the number of the matrices selected is displayed. |
4. Click the  Insert new intervals icon.
The Add intervals window opens.
5. Make the desired changes.
|
Element |
Description |
|
Lower limit |
Lowest interval value Note The lower limit is not included in the interval. |
|
Upper limit |
Highest interval value Note The upper limit is part of the interval. |
|
Number of intervals |
The number of intervals |
|
Notes: By default, the OD pairs in the matrices selected are classified according to their matrix values. However, you can also perform classification using the matrix values of another matrix. To do so, click the button |

6. Confirm with OK.
The intervals are added to the bottom section of the window.
|
Notes: Alternatively, click the button You can also copy the intervals from another Histogram window. To do so, in the other Histogram window, click the |


7. You can then edit the intervals, if required.
|
Notes: To edit the interval limits, double-click them. The lower limit is not included in the interval, the upper limit is part of the interval (a < x ≤ b). To delete highlighted intervals, on the Histogram window toolbar, click the As long as the classification has not been recalculated, edited intervals are labeled in brown. |

8. When you have finished editing, click the  Recalculate classification symbol or the Recalculate button in the note.
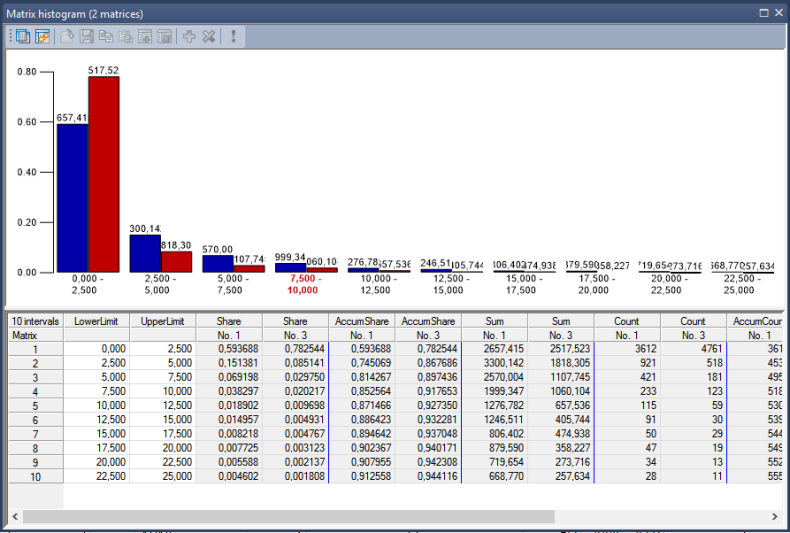
The histogram is then shown in the top section of the window. The values calculated are displayed in the list. The LastShare column contains values of the last calculation.
|
Notes: Use the The histogram settings can be saved as a layout file (Saving and opening the layout of a Matrix editor, histogram, or matrix comparison window). You can save the intervals to a *.att file (Saving intervals to an attribute file). If you change matrix values in the selected matrices, the histogram view is automatically refreshed. If you change intervals after calculating the histogram, the view is not automatically refreshed. The columns are displayed in gray, the values calculated are shown in brown. To refresh the view of the histogram, click the In the matrix histogram, you also have the option of filtering the display by zones, OD pairs or matrix values. (Filtering matrix data). |

